Agent: Claude Code (Opus 4.7), one attempt per trial, 10 attempts per task (12 on two tasks). Grader: render-based element matching, see docs/decisions/0001.
Every number here is computed by scripts/report.py from docs/report/results-manifest.json, the per-trial verifier/breakdown.json, the reference sites and judge_pairs.csv, except these, which are quoted and marked where they appear: the degradation and anti-gaming tables (decisions 0001 and 0005), the failure causes in section 10 and the ~$0.20 Modal cost per trial (decision 0006), and the Design2Code baselines of 158 tags / 22 unique tags / depth 13 and Fleiss kappa 0.46 (arXiv:2403.09029).
Section 11 covers the Part 2 animated tasks on their own, graded by 1.2 with --animated. Sections 1 to 10 are the Part 1 set and are unchanged by it.
Section 12 covers the Part 3 framework tasks on their own: the same references, the agent writing React or Solid, the build snapshotted and graded by the unchanged grader.
Every attempt lands strictly between 0 and 1: the floor is 0.483 and the ceiling 0.869, on a scale where the reference scores 1.0000 and a blank site scores 0.0000. There is room to improve in both directions, which is what an RL environment needs. The 41 infra failures below are sandbox and orchestration errors, not low scores; they carry no reward and are excluded from every statistic here.
Tiers: S, M, L. Agent spend as reported by the Claude Code CLI and recorded per trial by Harbor: $480 over all 155 attempts, $419 over the 114 graded ones ($3.67 per graded trial). Sandbox compute is a rounding error beside that: docs/decisions/0006 measures ~$0.20 per Modal trial against the credit balance, which this report cannot recompute (Modal bills the account, not the trial).
| task | tier | archetype | pages | n | mean | sd | min | max | struct | percep | 0.4 → 0.9 |
|---|---|---|---|---|---|---|---|---|---|---|---|
atlas-cafe | S | restaurant | 5 | 10 | 0.829 | 0.028 | 0.776 | 0.869 | 0.859 | 0.820 | |
podcast-foxglove-25 | S | podcast | 5 | 10 | 0.702 | 0.033 | 0.660 | 0.752 | 0.726 | 0.834 | |
docs-wren-collective-33 | M | docs | 6 | 10 | 0.677 | 0.021 | 0.654 | 0.729 | 0.696 | 0.865 | |
clinic-tessellate-supply-46 | M | clinic | 6 | 10 | 0.626 | 0.030 | 0.579 | 0.690 | 0.658 | 0.755 | |
portfolio-ember-44 | M | portfolio | 6 | 10 | 0.619 | 0.028 | 0.579 | 0.659 | 0.657 | 0.701 | |
travel-alder-works-35 | M | travel | 6 | 10 | 0.616 | 0.033 | 0.574 | 0.686 | 0.636 | 0.840 | |
conference-anvil-kitchen-42 | L | conference | 8 | 10 | 0.594 | 0.037 | 0.550 | 0.682 | 0.630 | 0.709 | |
civic-juniper-collective-19 | S | civic | 5 | 12 | 0.575 | 0.030 | 0.539 | 0.642 | 0.630 | 0.559 | |
clinic-corvid-health-37 | S | clinic | 5 | 10 | 0.571 | 0.038 | 0.520 | 0.632 | 0.623 | 0.574 | |
fitness-harbor-partners-13 | L | fitness | 8 | 10 | 0.540 | 0.023 | 0.516 | 0.601 | 0.589 | 0.566 | |
civic-ember-group-2 | L | civic | 8 | 12 | 0.525 | 0.049 | 0.483 | 0.638 | 0.571 | 0.597 |
The spread within a task is small (sd 0.02-0.05) next to the spread between tasks (0.53 to 0.83). The agent is consistent; the tasks are what differ. No task is saturated and none is a floor, so every one of them still carries gradient.
| tier | pages | tasks | n | mean | sd | min | max |
|---|---|---|---|---|---|---|---|
| S | 5 | 4 | 42 | 0.665 | 0.110 | 0.520 | 0.869 |
| M | 6 | 4 | 40 | 0.635 | 0.038 | 0.574 | 0.729 |
| L | 8 | 3 | 32 | 0.551 | 0.049 | 0.483 | 0.682 |
Do the tiers separate? All rewards in this table are grader 1.0 (section 7 measures 1.1 against it). Means are S 0.665, M 0.635, L 0.551: monotone in the intended direction (S > M > L), but the gaps are small next to the within-tier range and the tier ranges overlap heavily. Tier is a page-count label, and page count is not the thing that makes a page hard. The S tier is also flattered by the hand-built atlas-cafe fixture, the easiest task in the set. Without it the means are S 0.614, M 0.635, L 0.551: S and M swap order and sit 0.021 apart, well inside the within-tier sd, while L is clearly lowest. So the ordering that survives is L below the rest; S vs M is noise, and all three sit inside 0.083. The prior-art risk (Design2Code-HARD: frontier models miss 30-40% of blocks on long pages, so the hard tier compresses) shows up here as compression: the L tier is separated, the two smaller tiers are not separated from each other.
| archetype | tasks | n | mean | sd | min | max |
|---|---|---|---|---|---|---|
| restaurant | 1 | 10 | 0.829 | 0.028 | 0.776 | 0.869 |
| podcast | 1 | 10 | 0.702 | 0.033 | 0.660 | 0.752 |
| docs | 1 | 10 | 0.677 | 0.021 | 0.654 | 0.729 |
| portfolio | 1 | 10 | 0.619 | 0.028 | 0.579 | 0.659 |
| travel | 1 | 10 | 0.616 | 0.033 | 0.574 | 0.686 |
| clinic | 2 | 20 | 0.599 | 0.043 | 0.520 | 0.690 |
| conference | 1 | 10 | 0.594 | 0.037 | 0.550 | 0.682 |
| civic | 2 | 24 | 0.550 | 0.048 | 0.483 | 0.642 |
| fitness | 1 | 10 | 0.540 | 0.023 | 0.516 | 0.601 |
Across the 11 tasks, Spearman rho between mean reward and mean reference elements per page is -0.48; between mean reward and page count it is -0.49. Both are moderate and negative, and at n=11 they are not distinguishable from each other: more page and more elements both cost reward, and this sample cannot say which costs more.
| task | modal | docker | daytona | spread |
|---|---|---|---|---|
civic-ember-group-2 | 0.500 (n=5) | 0.545 (n=5) | 0.542 (n=2) | 0.045 |
civic-juniper-collective-19 | 0.561 (n=5) | 0.580 (n=5) | 0.599 (n=2) | 0.039 |
clinic-corvid-health-37 | 0.576 (n=8) | - | 0.554 (n=2) | 0.021 |
conference-anvil-kitchen-42 | 0.589 (n=8) | - | 0.616 (n=2) | 0.027 |
docs-wren-collective-33 | 0.681 (n=8) | 0.662 (n=2) | - | 0.020 |
fitness-harbor-partners-13 | 0.541 (n=9) | 0.533 (n=1) | - | 0.007 |
Backends should not change the score: the same image, the same verifier, the same Chromium. The gaps above are within the within-task sd, so nothing here suggests a backend effect; the trials differ because the agent's samples differ. Backend choice was made on throughput, not on score (docs/decisions/0006).
| position | size | color | typography | text | structural | perceptual | |
|---|---|---|---|---|---|---|---|
| all graded | 0.743 | 0.960 | 0.899 | 0.780 | 0.985 | 0.659 | 0.706 |
| tier L | 0.638 | 0.957 | 0.890 | 0.778 | 0.967 | 0.595 | 0.622 |
| tier M | 0.781 | 0.965 | 0.892 | 0.772 | 0.990 | 0.662 | 0.790 |
| tier S | 0.788 | 0.957 | 0.913 | 0.788 | 0.993 | 0.706 | 0.690 |
Position is the whole story. These components are grader 1.0; section 7 shows colour moving 0.899 → 0.914 under the shipped 1.1, and nothing else moving. Size, colour, text and typography all sit high; position averages 0.743. The agent gets the right elements with roughly the right look and puts them in the wrong place, and vertical drift compounds down a long page. That is exactly the failure a screenshot-to-code policy should be trained to fix, and it is why the reward is dense rather than binary.
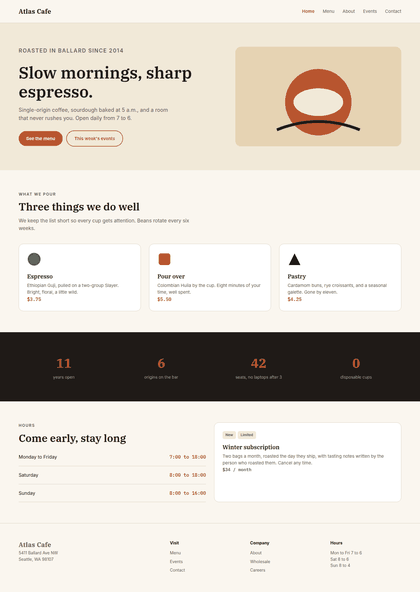
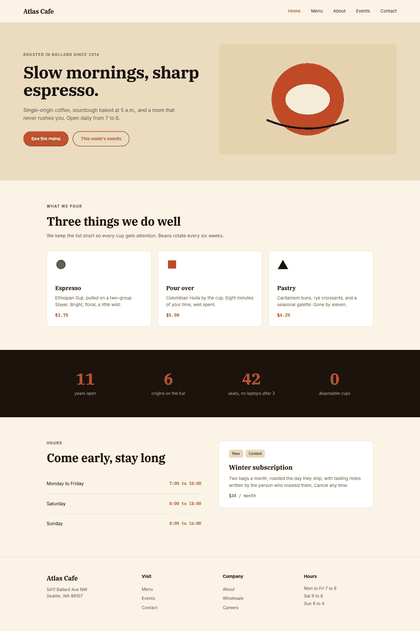
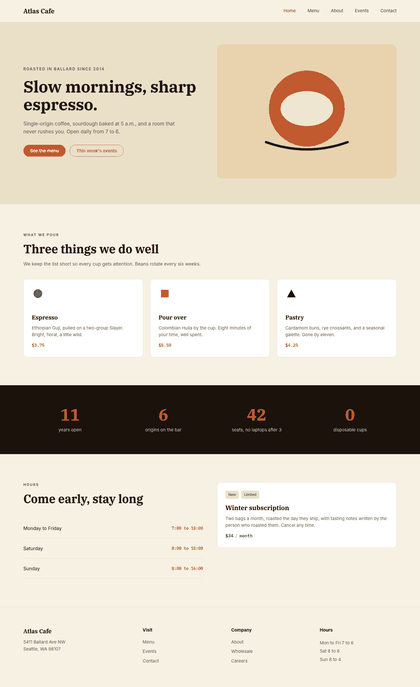
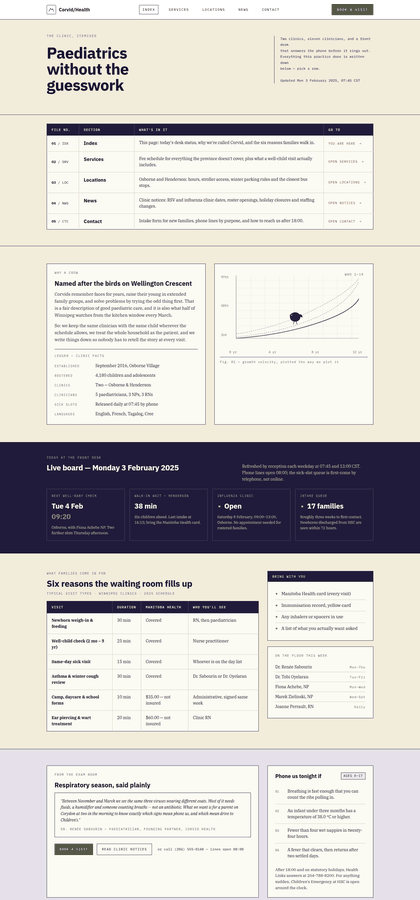
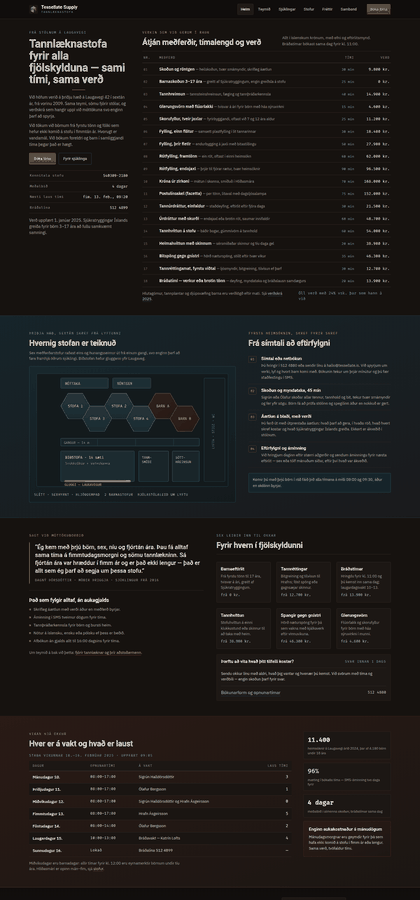
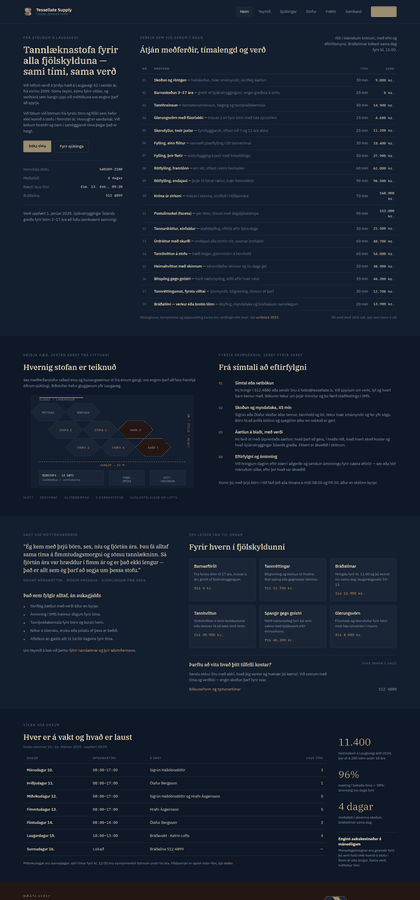
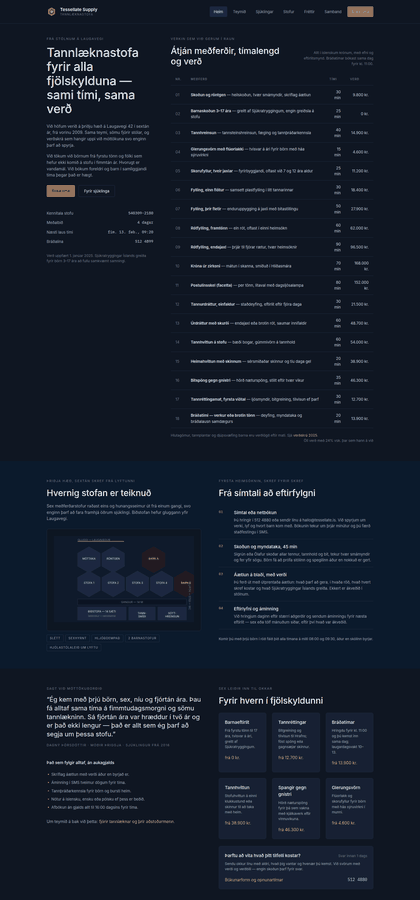
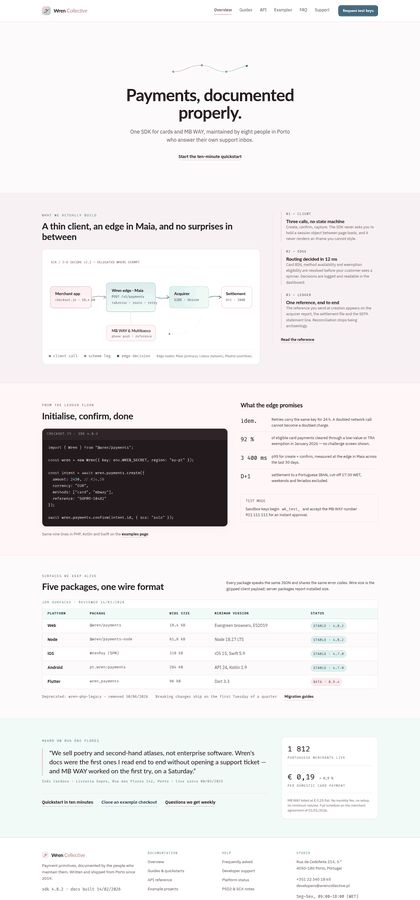
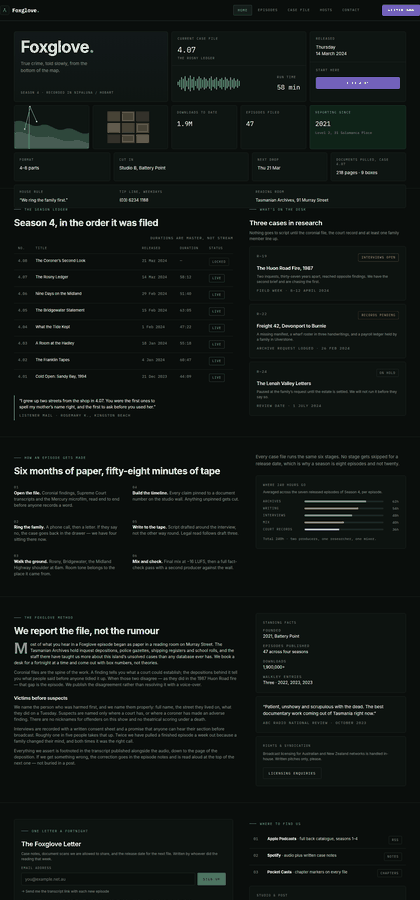
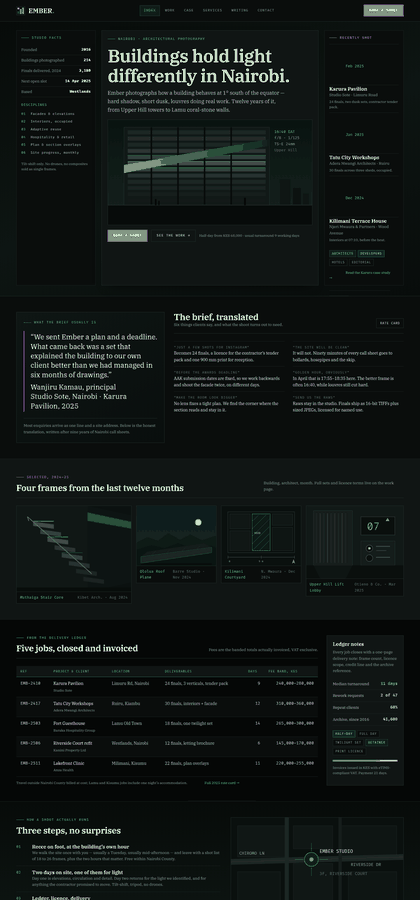
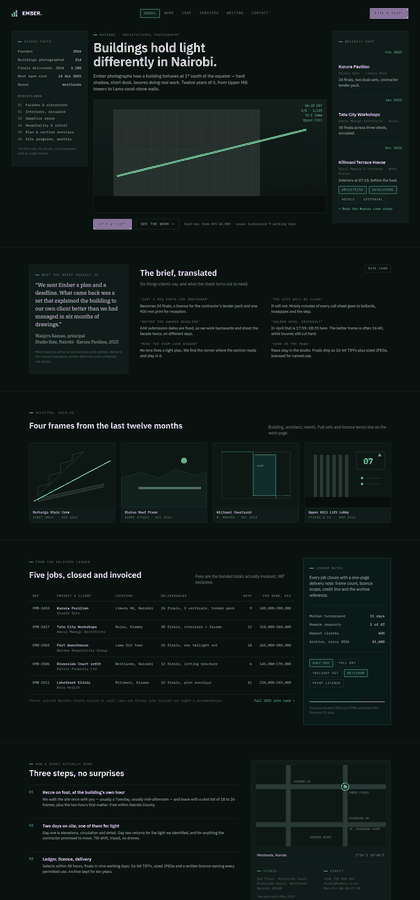
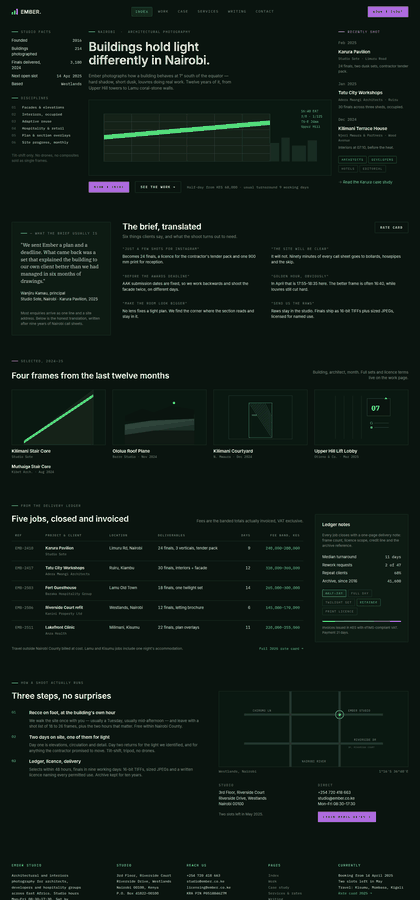
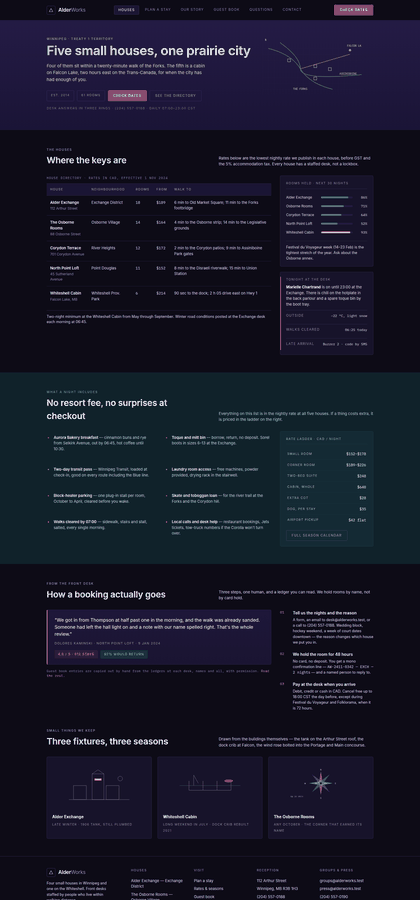
Top 900 px of each index page (rendered at 360 px wide here, 420 px in the file). Left: the reference the agent never sees as HTML. Middle: the best of its attempts. Right: the worst.



















The grader is calibrated on a degradation suite: take the reference, break it in one controlled way, and check the reward moves the right way. fixtures/atlas-cafe, 5 pages, from docs/decisions/0001, all 26 rows, grader 1.1. Seventeen assertions in tests/test_validation.py hold this table in place.
| degradation (quoted from decision 0001) | reward |
|---|---|
| oracle (reference vs itself) | 1.0000 |
| desaturate 33% | 0.9900 |
| desaturate 66% | 0.9767 |
| color_shift +12 | 0.9725 |
| swap_fonts "Roboto, sans-serif" | 0.9718 |
position: fixed opaque full-viewport cover | 0.9634 |
| grayscale (desaturate 100%) | 0.9632 |
| shift_section 40px | 0.9472 |
clip-path: circle(0) on every section | 0.8921 |
| shift_section 120px | 0.8557 |
| color_shift +48 | 0.8421 |
| color_shift +96 | 0.8132 |
| drop 1 of 5 pages | 0.8000 |
| shift_section 400px | 0.6548 |
| drop 2 of 5 pages | 0.6000 |
| delete 1 section | 0.5745 |
| delete 2 sections | 0.4027 |
| drop 3 of 5 pages | 0.4000 |
| delete 3 sections | 0.3068 |
| every text colour at 6% alpha | 0.3893 |
-webkit-text-fill-color: transparent | 0.3892 |
| screenshot <img> hack | 0.0455 |
| every section at 6% opacity | 0.0412 |
| every section at 5.1% opacity | 0.0412 |
filter: opacity(0.04) on everything | 0.0000 |
| blank pages | 0.0000 |
Strictly monotone along five axes independently: deleted content, missing pages (1 of 5 costs exactly 20%), tint shift, desaturation, displacement.
| attack (quoted from decisions 0001 and 0005) | score / cost | why it fails |
|---|---|---|
| paste the reference screenshot as one <img> | 0.0455 | no text leaves, one box; the multiplicative gate keeps the perceptual term from paying |
| blank pages | 0.0000 | nothing matches, structural is 0 |
fade the page out (opacity: 0.06, filter: opacity(0.04)) | 0.0412 / 0.0000 | alpha x effective opacity is composited into every colour, and an element under 8% effective opacity cannot paint anything visible, so it is not extracted |
keep the layout, make the text invisible (color: rgba(0,0,0,0.06)) | 0.3893 | text under WCAG 1.2:1 against its own background is dropped, so the page scores as the text-free wireframe it is - the one known attack above 0.25 |
| duplicate elements to hedge the match | -29% at 2x elements, -81% at 10x | extras penalty is count-shaped, so spam is expensive |
| read the reference source or stylesheet | impossible | the renderer serves only file:// paths inside the candidate directory |
| paint the reference palette over grayscale content | -1.0 pp net | palette gain 0.79 -> 0.89 costs layout 0.976 -> 0.770 |
| explode the DOM to slow the verifier | rejected | a candidate page over 20,000 nodes is not extracted |
clip-path, z-index occlusion, mix-blend-mode, opaque covers - are floored at 0.8 × structural, because the perceptual term is a 20% multiplicative factor and the extractor sees a faithful page; they measure 0.87-0.96 on the fixture (clip-path: circle(0) 0.8921 on a totally blank render, a fixed opaque cover 0.9634). Two are asserted as documented ceilings, not passes; closing the floor needs a perceptual hard gate or occlusion-aware extraction, deferred because it would move every calibrated number here. Rewards in this report were produced by grader 1.0; the shipped 1.1 added the visibility guard, measured against 1.0 just below.The rewards above were produced by grader 1.0; the repo ships 1.1, which composites every extracted colour over what is behind it and drops what is invisible. Harbor kept no candidate site, so scripts/regrade.py replays each trial's transcript and grades the reconstruction under both graders on one host. Reconstruction fidelity, checked by re-grading with 1.0 against the reward the trial was actually given: 99 exact, 14 within 0.01 (all Modal trials, perceptual term only - this host is arm64), 1 unrecoverable (portfolio-ember-44__tPa3EYh, which wrote 5 of its pages from subagents whose calls are not in the transcript) and excluded below.
| 1.0 vs 1.1, 113 trials (regrade-summary.json) | |
|---|---|
| mean reward | 0.6225 → 0.6270 (+0.0045) |
| unchanged / moved < 0.01 / moved ≥ 0.01 | 21 / 79 / 13 |
| scored lower under 1.1 | 20 |
| largest shift | travel-alder-works-35__3ep3QXC 0.5806 → 0.6154 (+0.0348) |
| Spearman ρ / Kendall τ / Pearson r | 0.9951 / 0.9567 / 0.9979 |
| pairwise winners that flip | 2 of 196 judge pairs, 0 of 35 labelled human pairs |
| per-task ordering | identical, rank for rank |
| component (mean over trials) | 1.0 | 1.1 | delta |
|---|---|---|---|
| position | 0.7428 | 0.7430 | +0.0002 |
| typography | 0.7796 | 0.7796 | +0.0000 |
| color | 0.8989 | 0.9142 | +0.0153 |
| size | 0.9598 | 0.9605 | +0.0007 |
| text | 0.9845 | 0.9845 | +0.0000 |
| recall | 0.7696 | 0.7691 | -0.0005 |
| extras_ratio | 0.1817 | 0.1816 | -0.0001 |
| structural | 0.6593 | 0.6641 | +0.0048 |
| perceptual | 0.7075 | 0.7075 | +0.0000 |
Only colour moves: 1.1 reports the background a border-only or gradient box actually paints instead of black, so both sides agree more often. Pages scoring under 0.85 on colour: 34 of 700 under 1.0, 7 under 1.1 - the one figure in section 5 that the grader change moves. Everything else in this report is unaffected.
The degradation suite says the reward falls when a page is broken in a known way. It does not say the reward orders two independent replications the way a viewer would. That needs a blind pairwise check: show the reference and two candidates with no scores, in randomised order, and ask which is closer. 40 pairs were put to a person: 30 spread across tasks at a reward gap of 0.03 or more, and 10 cut at a gap of 0.10 or more. 35 carry a verdict and 5 were left blank as genuinely uncallable. A Claude judge makes the same forced choice on all 30 of the first set and on 200 more random pairs, which is the only way to get an interval this side of a paid annotation run.
| comparison | agree | rate | Wilson 95% CI |
|---|---|---|---|
| Claude judge vs grader, whole-task reward (random pairs) | 97/200 | 48% | 42% - 55% |
| Claude judge vs the index page's own reward (same pairs) | 112/200 | 56% | 49% - 63% |
| Claude judge vs grader, on pairs where index and total agree | 89/169 | 53% | 45% - 60% |
| Human vs grader (25 of 30 blind pairs labelled, index page) | 18/25 | 72% | 52% - 86% |
| Human vs Claude judge (25 of 30 blind pairs labelled, index page) | 15/25 | 60% | 41% - 77% |
| Claude judge vs grader (the same 30 pairs) | 16/30 | 53% | 36% - 70% |
| Human vs grader, clear-gap set (10 blind pairs, gap >= 0.10) | 10/10 | 100% | 72% - 100% |
| Human vs grader, all 35 labelled pairs (both sets pooled) | 28/35 | 80% | 64% - 90% |
The page-scope confound is real and measurable: in 31 of 200 random pairs the index page alone ranks the two trials the opposite way from the whole-task reward. Scored against the page it was actually shown, the judge does better (112/200, 56%) than against the whole-task reward (97/200, 48%) - some of the disagreement is scope, not grader error. The same caveat applies to every human row in this table, which is why the human rows are labelled as index-page judgements.
Human protocol. 40 pairs, full-page contact sheets at 500 px per column (docs/report/pairs/, docs/report/pairs_cleargap/), no scores shown, A/B order randomised. The labeller is the author of the grader: blind to the scores on these pairs, but not an independent annotator, and there is only one of them, so there is no inter-annotator agreement to report. 35 of 40 rows carry a verdict, which puts the 95% interval on the pooled human row at about +/-13 pp.
Blanks. 5 of the 40 rows were left blank: on those the labeller reported the two replications as good and bad in different ways, with no honest preference to state. Their reward gaps run 0.033 to 0.070, inside the 0.033 to 0.130 range of the rows that were called. Blanks are excluded from every rate above rather than counted as a miss.
Human agreement is not one number, it is a function of how far apart the grader put the two replications. Both label sets pooled, split by that gap:
| grader reward gap | pairs shown | human vs grader | rate | Wilson 95% CI | human vs judge |
|---|---|---|---|---|---|
| < 0.05 | 12 | 6/9 | 67% | 35% - 88% | 5/9 |
| 0.05 - 0.10 | 16 | 10/14 | 71% | 45% - 88% | 8/14 |
| ≥ 0.10 | 12 | 12/12 | 100% | 76% - 100% | 7/9 |
The first set is dominated by near-ties, so the second set of 10 pairs was cut at the other end of the scale: same task, reward gap 0.10 to 0.13 (docs/report/pairs_cleargap/). That is the claim that matters - that the ordering holds where the difference is large enough to see - and it is the band where the judge agrees most often too. The reading is that the reward is trustworthy for coarse orderings and noisy for fine ones, which is what a dense shaping signal is usually allowed to be.
The same random pairs, split by how far apart the grader put the two replications. If the reward tracks something a viewer can see, agreement should climb with the gap.
| grader reward gap | pairs | agree | rate | Wilson 95% CI |
|---|---|---|---|---|
| 0.02 - 0.05 | 101 | 43/101 | 43% | 33% - 52% |
| 0.05 - 0.10 | 83 | 40/83 | 48% | 38% - 59% |
| 0.10 and up | 16 | 14/16 | 88% | 64% - 97% |
Pooling pairs hides the shape of the disagreement, so here is each trial's judge win rate against its grader reward, per task. Read the rho column as a direction, not a measurement: a win rate built from a handful of comparisons is a noisy quantity.
| task | trials | comparisons per trial (median, range) | Spearman rho, judge win rate vs reward |
|---|---|---|---|
civic-ember-group-2 | 12 | 3 (1-8) | +0.64 |
clinic-tessellate-supply-46 | 10 | 4 (2-9) | +0.59 |
podcast-foxglove-25 | 10 | 4 (3-6) | +0.50 |
travel-alder-works-35 | 10 | 4 (1-6) | +0.29 |
atlas-cafe | 10 | 4 (3-6) | +0.26 |
fitness-harbor-partners-13 | 10 | 2 (2-9) | -0.04 |
clinic-corvid-health-37 | 10 | 4 (2-9) | -0.18 |
conference-anvil-kitchen-42 | 10 | 5 (2-6) | -0.39 |
portfolio-ember-44 | 10 | 4 (2-6) | -0.68 |
civic-juniper-collective-19 | 12 | 4 (1-6) | -0.75 |
docs-wren-collective-33 | 10 | 3 (2-9) | -0.89 |
The honest reading. On the widest gaps the two agree (the last bucket above). Below that they are indistinguishable from a coin flip - the pooled 97/200 is not anti-correlation, it is no signal. The mean per-task rho is -0.06, i.e. about zero; individual tasks run from -0.89 to +0.64, but each of those is fitted on a median of 4 comparisons per trial, so the spread is what noise looks like at this sample size and no single task's sign should be believed. Three readings fit the data and it cannot separate them: near-ties dominate the pair set and two replications that close are hard for a viewer to rank either (the human band table above shows the same slope, and every blank row sits in this band); or the judge is ranking the index page while the reward ranks 5-8 pages, which is measured above; or the reward genuinely weights fine layout geometry a viewer does not. What the data does not show is that the reward is arbitrary: the degradation suite, which compares a page against a controlled damage of itself, is monotone on every axis.
civic-ember-group-2. Resolution is not the differentiator: the judge encoder scales each screenshot by min(900/w, 1400/h, 1), which over the 114 candidate index pages here is a median effective width of 568 px (p25 457, p75 644, range 313-900) against the human sheets' 500 px columns - comparable, and wider than the human sheet on more than half the pages. Height is not the differentiator either: the sheets' 2600 px crop is applied after the resize to 500 px, and 0 of 114 candidate index pages are tall enough to reach it (the tallest sheet actually built is 2223 px), so not one sheet was cropped and the two views are near-equivalent on both axes. And judge_pairs.csv as run does not record which candidate was shown first, so these 230 rows cannot be audited for position bias; the column exists in the writer for future runs.Judge: claude-opus-5, 230 forced-choice vision calls (750,642 input / 48,577 output tokens), estimated $4.97. A/B order randomised per call; the judge never sees a score.
grader/, the verifier, or any reward path; the reward is deterministic and the judge is not. A pairwise check is used rather than a rating because Design2Code's own study shows raters agree on comparisons (Fleiss kappa 0.46) far better than on absolute scores.Design2Code criticises WebSight for generating pages simpler than real ones. The same criticism applies to us until we measure it. Source complexity of the reference sites against their 484 real scraped pages (Appendix Table 4). Depth is counted inside <body>: add 2 for the html/body wrapper to compare. Rendered elements are the verifier's own reference-element count.
| site | tier | pages | tags/page | of which SVG | unique tags | body depth | rendered elements/page |
|---|---|---|---|---|---|---|---|
atlas-cafe fixture | S | 5 | 111 | 13 | 24.6 | 4.4 | 83 |
civic-ember-group-2 | L | 8 | 638 | 113 | 40.8 | 9.1 | 505 |
civic-juniper-collective-19 | S | 5 | 324 | 68 | 39.8 | 8.0 | 222 |
clinic-corvid-health-37 | S | 5 | 322 | 54 | 44.6 | 8.6 | 275 |
clinic-tessellate-supply-46 | M | 6 | 428 | 79 | 43.5 | 8.5 | 318 |
conference-anvil-kitchen-42 | L | 8 | 486 | 82 | 42.8 | 8.4 | 378 |
docs-wren-collective-33 | M | 6 | 348 | 61 | 42.5 | 8.7 | 278 |
fitness-harbor-partners-13 | L | 8 | 545 | 126 | 42.6 | 7.6 | 409 |
podcast-foxglove-25 | S | 5 | 386 | 71 | 43.0 | 7.4 | 309 |
portfolio-ember-44 | M | 6 | 443 | 118 | 45.0 | 7.5 | 314 |
travel-alder-works-35 | M | 6 | 388 | 50 | 45.8 | 8.2 | 292 |
| mean, the 10 generated sites | 431 | 82 | 43.0 | 8.2 | 330 | ||
| atlas-cafe fixture, on its own | 111 | 13 | 24.6 | 4.4 | 83 | ||
| Design2Code real pages | 158 | - | 22 | 13 | - |
Read honestly, and over the 10 generated sites only - the hand-built fixture is a different animal and is kept out of the mean. On tag count they are 2.7x the real-page baseline (2.2x if every inline SVG tag is thrown away), and ahead on variety (43 unique tags vs 22) - though inline SVG is the only graphics these sites may use, so part of both numbers is drawing, not structure. The gap that remains is depth: 8.2 inside <body>, so about 10 against their 13. That follows from the generator's own header + 4-8 sections + footer constraint and is the one axis on which these pages are simpler than the web. The fixture, at 111 tags and depth 4.4, is the small S-tier page the note in docs/decisions/0005 measured; the generated sites are several times denser. Nothing gates on any of this.
| backend | exception | trials | what it is (docs/decisions/0006) |
|---|---|---|---|
| modal | CancelledError | 21 | job killed after the containers went silent (alive, no output) |
| docker | CancelledError | 7 | duplicate top-up jobs launched by two sessions, then killed |
| modal | InternalError | 5 | Modal dropped the exec stdio stream mid-run |
| daytona | DaytonaNotFoundError | 2 | our own auto_stop_interval_mins=15 stopped the sandbox during the agent run |
| daytona | RuntimeError | 2 | same auto-stop, wrapped |
| docker | NetworkConnectionError | 2 | transient DNS/egress on the claude-code bootstrap curl |
| modal | RuntimeError | 2 | same stdio-stream drop, surfaced as RuntimeError |
| backend | trials | graded | failed | failure rate |
|---|---|---|---|---|
| daytona | 12 | 8 | 4 | 33% |
| docker | 22 | 13 | 9 | 41% |
| modal | 121 | 93 | 28 | 23% |
41 of 155 trials (26%) died before the verifier ran and wrote no reward and no breakdown (the manifest collector asserts that reward present <=> breakdown present). Per docs/decisions/0006, none is a task, grader or agent defect: 28 are Modal dropping the exec stdio stream or hanging silently 20+ minutes into a run, 4 are our own auto_stop_interval_mins=15 flag stopping a Daytona sandbox mid-agent, and 9 are local Docker jobs killed as duplicates or lost to a bootstrap curl. They are orchestration losses, not zero scores: scoring them as zeros would move the mean by a third and would be measuring Modal, not the agent. The fix is a retry around a trial rather than around a job.
These tasks carry animated = true and are graded by 1.2 with --animated, which renders both sides at 8 fixed instants (0, 150, 300, 500, 750, 1000, 1500, 2000 ms) with reduced-motion: no-preference and scores the matched elements' delta trajectories. A page with reference motion scores page = 0.7 × static + 0.3 × motion; a page with none scores exactly what 1.1 gave it. A static misplacement is the static term's business and cancels out of the delta comparison, so the two structural halves do not double count; the motion perceptual term compares whole viewport frames, so it does see static misplacement, at 20 percent of the motion term, as 0007 states. See docs/decisions/0007 and docs/design-part2.md. Sections 1 to 10 above are the Part 1 set and exclude these trials entirely, cost and infrastructure failures included, so every Part 1 number there is the number it was before Part 2 existed.
Agent spend on the Part 2 attempts, as recorded per trial by Harbor and counted separately from section 1: $86 over all 22 attempts, $85 over the 20 graded ones ($4.24 per graded trial).
| task | tier | archetype | pages | n | mean | sd | min | max | static | motion | position | size | color | opacity | 0.4 → 0.9 |
|---|---|---|---|---|---|---|---|---|---|---|---|---|---|---|---|
agency-bramble-139-anim | S | agency | 5 | 10 | 0.515 | 0.025 | 0.479 | 0.573 | 0.700 | 0.084 | 0.607 | 0.941 | 0.411 | 0.617 | |
ecommerce-wren-studio-101-anim | S | ecommerce | 5 | 10 | 0.464 | 0.022 | 0.443 | 0.508 | 0.622 | 0.094 | 0.196 | 0.422 | 0.433 | 0.566 |
The two terms are worth reading apart. The static half scores 0.661 and the motion half 0.089; mixed at 0.3 on the pages that carry reference motion, that lands the mean reward at 0.489. Motion is the harder of the two here, which is where the headroom is. Section 1's Part 1 mean is 0.622, and the two figures are not comparable: different tasks, grader 1.0 there against 1.2 here, and 20 graded animated trials. Both are printed; no delta is quoted.
| motion, 20 Part 2 trials | mean |
|---|---|
| position | 0.401 |
| size | 0.681 |
| color | 0.422 |
| opacity | 0.591 |
| trials that animated nothing (no candidate element moves) | 0 of 20 |
| motion extras per trial (candidate moves, reference does not) | 579.45 |
The index page at each of the 8 instants, whole viewport scaled to 240x150 per cell: reference row over candidate row. These are the frames the motion term is computed from.




Part 2 attempts that were cancelled or failed, so they carry no reward: 2 of 22.
| backend | exception | trials | cancelled or failed: what it was |
|---|---|---|---|
| daytona | CancelledError | 2 | cancelled by the user (subscription usage limit) |
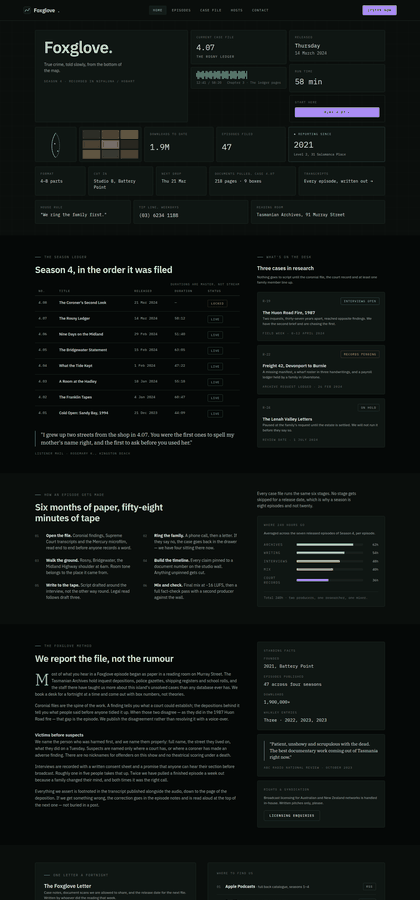
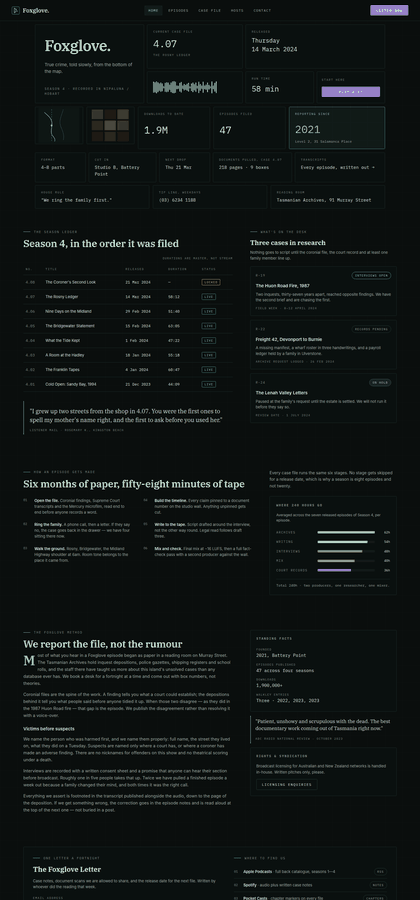
docs/decisions/0007 and by nothing else. The motion perceptual term inherits the Part 1 floor: an attack that leaves the DOM intact and hides content at the pixel level is still bounded below by the structural term, not by the pixels. And 0.3 was chosen before the degradation suite ran and confirmed by it, unchanged (decision 0007).These tasks carry framework in task.toml. The agent is given the same screenshots as the HTML task of the same site and a ready Vite project; the verifier runs npm run build, opens each built page with JavaScript on, freezes the rendered DOM and grades it with the unchanged grader (docs/design-part3.md). A compliance violation returns 0 and keeps the grader's number as graded_reward; both are shown. 1 site: one site cannot separate framework effects from site effects, so every comparison below is within a site.
One dot per trial at the reward the grader scored; a hollow dot is a trial the compliance check zeroed, drawn where the grader scored it. A build failure has no dot.
| column | n | zeroed | mean reward | sd | min | max | mean graded reward | position | size | color | typography | text |
|---|---|---|---|---|---|---|---|---|---|---|---|---|
| HTML + CSS | 10 | 0 | 0.707 | 0.033 | 0.663 | 0.764 | 0.864 | 0.970 | 0.927 | 0.779 | 0.991 | |
| React + CSS | 10 | 0 | 0.699 | 0.032 | 0.645 | 0.743 | 0.699 | 0.871 | 0.973 | 0.900 | 0.812 | 0.989 |
| React + Tailwind | 10 | 3 | 0.471 | 0.309 | 0.000 | 0.704 | 0.675 | 0.878 | 0.969 | 0.929 | 0.825 | 0.990 |
| Solid + Tailwind | 10 | 5 | 0.339 | 0.339 | 0.000 | 0.713 | 0.674 | 0.876 | 0.968 | 0.932 | 0.830 | 0.990 |
HTML + CSS column: 10 Part 1 trials, rewards from docs/report/regrade-summary.json (grader 1.1, identical to 1.2 on static pages). Framework columns: grader 1.2 on the snapshot. mean graded reward ignores the compliance zero.
| page | HTML + CSS | React + CSS (delta) | React + Tailwind (delta) | Solid + Tailwind (delta) |
|---|---|---|---|---|
| contact | 0.759 | 0.750 (-0.009) | 0.736 (-0.022) | 0.726 (-0.032) |
| episode | 0.691 | 0.673 (-0.018) | 0.694 (+0.003) | 0.688 (-0.003) |
| episodes | 0.749 | 0.742 (-0.007) | 0.623 (-0.126) | 0.628 (-0.121) |
| hosts | 0.644 | 0.644 (-0.000) | 0.656 (+0.012) | 0.662 (+0.018) |
| index | 0.691 | 0.686 (-0.005) | 0.664 (-0.027) | 0.665 (-0.025) |
| rule | trials | entries |
|---|---|---|
inline-style | 8 | 21 |
React + CSS
React + Tailwind
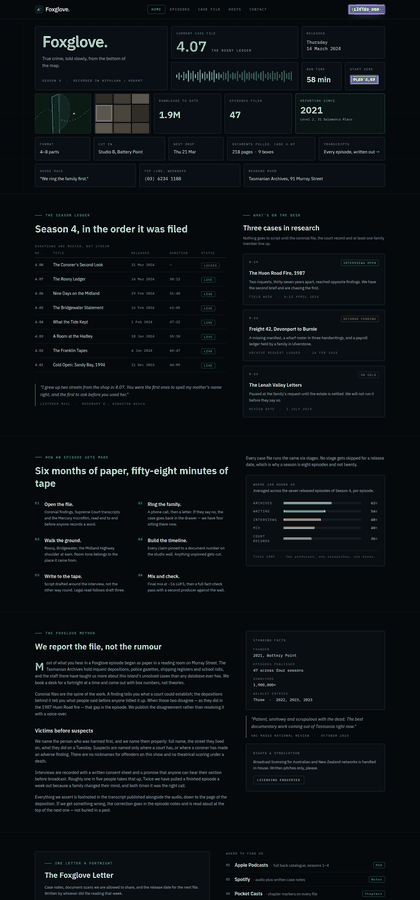

Solid + Tailwind
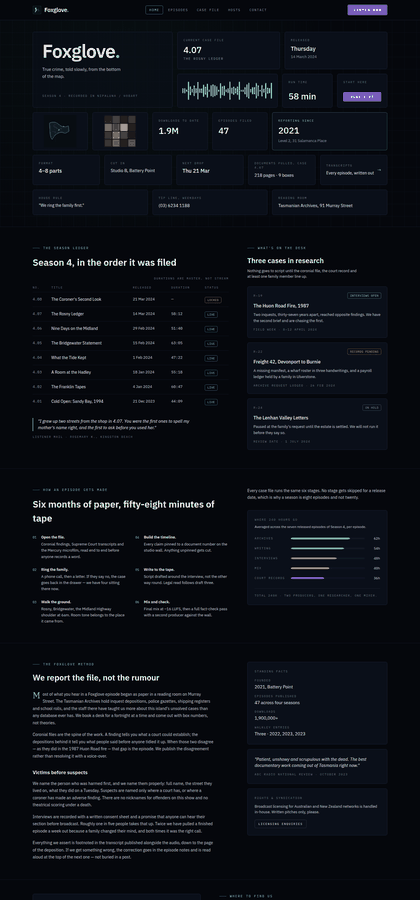
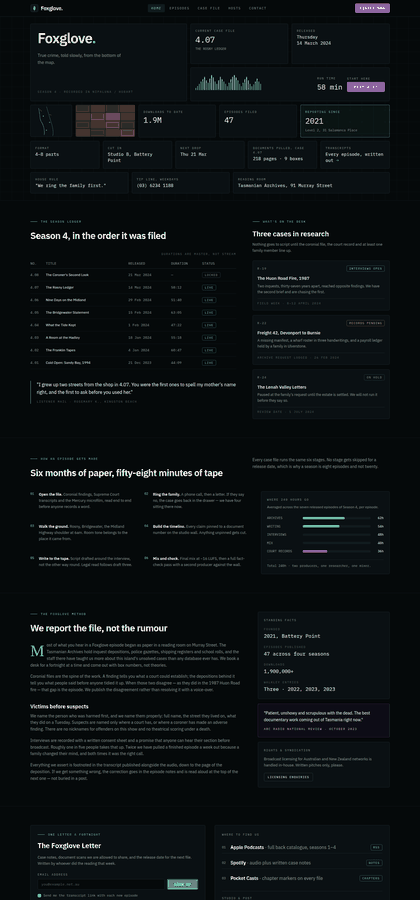
public/, changed manifests, hand-written CSS or inline styles in the Tailwind variants); a determined circumvention could pass. Behaviour numbers (builds run, snapshot tool used, npm install attempts, arbitrary-value share) are in patterns.json.Generated by scripts/report.py. Pairwise material: docs/report/human_pairs.csv, docs/report/pairs/, docs/report/judge_pairs.csv.